
|

|
|
Discussion of
factors affecting accuracy of the model |
|
|
|
The clear sky
solar radiation model calculates solar radiation at the Earth's
surface based on solar radiation at the top of the atmosphere
(extraterrestrial radiation) and empirical extinction coefficients
for direct beam and diffuse radiation components. The extinction
coefficients are calculated from empirically-derived equations that
account for the physical factors that govern radiative transfer
through the atmosphere, such as atmospheric composition and air
mass. Extraterrestrial radiation is based on a theoretical
calculation from the solar constant, and accounts for day of year,
time of day, latitude, and longitude. These factors determine the
position of the sun relative to the measurement site, and thus the
solar radiation at the top of the atmosphere magnitude for the given
site.
Based on comparison to solar
radiation measurements from multiple sites representing a wide range
of conditions, the accuracy of the clear sky radiation model can be
+/- 3 % if the calculation is made in the summer, near solar noon,
and on a cloudless, non-polluted day (Rick Allen, personal
communication). Achieving this accuracy requires that all of the
inputs are measured or estimated accurately (air temperature,
relative humidity, day of year, time of day, elevation, latitude,
and longitude).
|
Good accuracy also requires
completely clean air. An additional source of error is atmospheric
haze caused by particulate matter and aerosols in the air. Haze can
reduce the incident radiation at solar noon by 6% and in some
instances by as much as 10%. In some locations, haze is common
during the summer months and is usually visually apparent. The
presence of haze causes sensors to read lower than the model
estimate, resulting in a false impression of downward sensor drift.
If you live in a location with haze it is particularly important to
compare readings over multiple days. In these locations, the best
time to make a comparison is a clear day shortly after a rainfall
event when the rain washes the particulate matter out of the air.
|
When
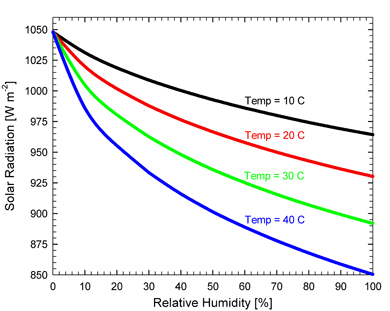
the model is run at solar noon, the figures below show the effect of
each input parameter on model output. Relative humidity and
temperature (figures 1 and 3) have the largest effect on model
output.
|
|
 |
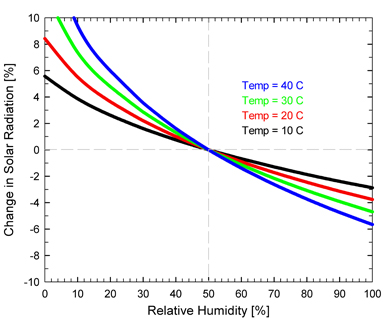 |
Figure 1:
Clear sky solar radiation [W m-2] calculated from the
model (y-axis) as a function of relative humidity (RH)
[%] (x-axis) at 10, 20, 30, 40 C. Radiation decreases with
increasing humidity due to increasing attenuation by water vapor
molecules. For example, at 30 C and 50 % RH, radiation is 935 W
m-2.
If RH
decreased to 40 %, radiation would increase about 1.5% to 950 W
m-2. If RH increased to 60 %, radiation would
decrease about 1% to 925 W m-2.
|
Figure 2:
Clear sky solar radiation error [%] (relative to clear sky solar
radiation at the relative humidity (RH) of the measurement site)
(y-axis) as a function of the RH [%] (x-axis) at 10, 20, 30, 40
C air temperature (it is assumed site RH is 50 %). Radiation
decreases with increasing humidity due to increasing attenuation
by water vapor molecules. For example, at 30 C if estimated RH
was 10 % lower or higher than actual RH, the error in clear sky
solar radiation is approximately +1 and -1 %, respectively. As
the air temperature increases, the error in clear sky solar
radiation increases.
|
|
 |
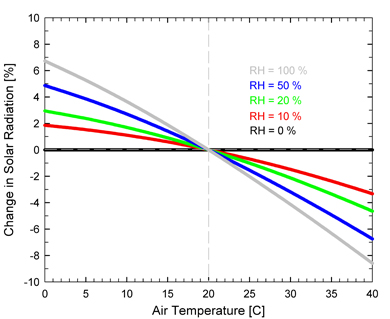 |
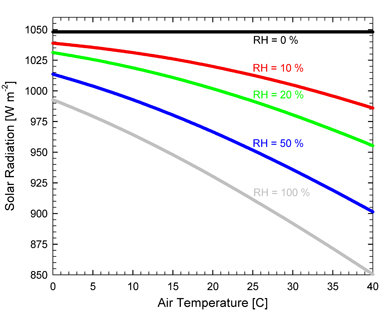
Figure 3:
Clear sky solar radiation [W m-2]
calculated from the model (y-axis) as a function of air
temperature [C] (x-axis) at 0, 10, 20, 50, 100 % relative
humidity. Radiation decreases with increasing temperature due to
increasing attenuation by water vapor molecules (even though
humidity is constant, at higher temperature, the air has a
greater capacity to hold water vapor).
For example,
at 20 % RH and 20 C, radiation is 1000 W m-2. If air
temperature decreased to 15 C, radiation would increase 1% to
1010 W m-2, and if air temperature increased to 25 C,
radiation would decrease 1% to 990 W m-2.
|
Figure 4:
Clear sky solar radiation error [%] (relative to clear sky solar
radiation at the air temperature of the measurement site)
(y-axis) as a function of the air temperature [C] (x-axis) at 0,
10, 20, 50, 100 % relative humidity (it is assumed site air
temperature is 20 C). Radiation decreases with increasing
temperature due to increasing attenuation by water vapor
molecules (even though humidity is constant, at higher
temperature, the air has a greater capacity to hold water
vapor).
For example,
at 20 % RH if estimated air temperature was 5 C lower or higher
than actual air temperature, the error in clear sky solar
radiation is approximately +1 and -1 %, respectively. As the RH
increases, the error in clear sky solar radiation increases.
|
|
|
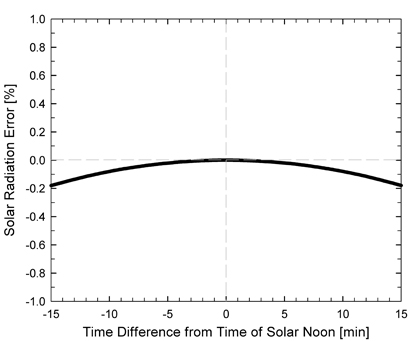 |
Figure 5:
Clear sky solar radiation error [%] (relative to clear sky solar
radiation at solar noon) (y-axis) as a function of the time
difference from solar noon (x-axis). The plot shows the
error in the clear sky solar radiation calculation if there is
an error in the time measurement input into the model. For
example, if the clock used to measure time was 10 minutes behind
actual time (-10) or 10 minutes ahead of actual time (+10), the
error in clear sky solar radiation is approximately -0.1 %.
|
|
|
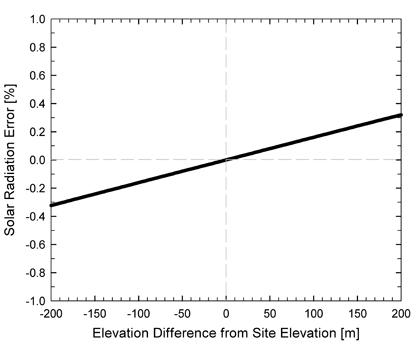 |
Figure 6:
Clear sky solar radiation error [%] (relative to clear sky solar
radiation at the elevation of the measurement site)
(y-axis) as a function of the elevation difference from
measurement site elevation (x-axis). The plot shows the error in
the clear sky solar radiation calculation if there is an error
in the elevation measurement/estimate input into the model. For
example, if the elevation is 100 meters lower (-100) or 100
meters higher (+100) than the actual measurement site elevation,
the error in clear sky solar radiation is approximately -0.15
and +0.15 %, respectively.
|
|
|
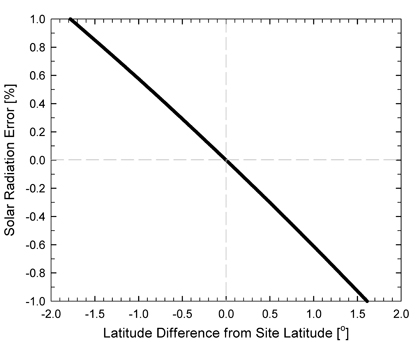 |
Figure 7:
Clear sky solar radiation error [%] (relative to clear sky solar
radiation at the latitude of the measurement site)
(y-axis) as a function of the latitude difference from
measurement site latitude (x-axis). The plot shows the error in
the clear sky solar radiation calculation if there is an error
in the latitude measurement/estimate input into the model. For
example, if the latitude is 1 degree less (-1) or 1 degree
greater (+1) than the actual measurement site latitude, the
error in clear sky solar radiation is approximately +0.6 and
-0.6 %, respectively.
|
|
|
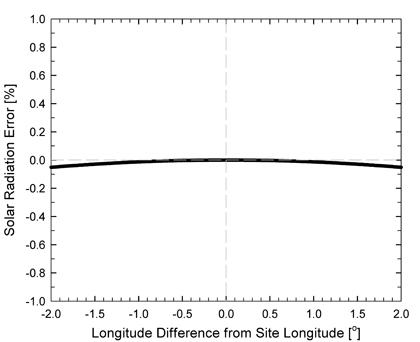 |
Figure 8:
Clear sky solar radiation error [%] (relative to clear sky solar
radiation at the longitude of the measurement site)
(y-axis) as a function of the longitude difference from
measurement site longitude (x-axis). The plot shows the error in
the clear sky solar radiation calculation if there is an error
in the longitude measurement/estimate input into the model. For
example, if the longitude is 1 degree less (-1) or 1 degree
greater (+1) than the actual measurement site longitude, the
error in clear sky solar radiation is approximately -0.05 %.
|
|
All the data shown in the graphs are for solar
noon on the summer solstice. For measurements made near solar noon
(within an hour) in the summer months, small errors in time (+/- 10
minutes), elevation (+/- 100 meters), latitude (+/- 1 degree), and
longitude (+/- 1 degree) have a negligible (less than 1 %) effect on
the prediction of clear sky solar radiation from the model. However,
errors in the measurement/estimate of air temperature and relative
humidity have a much larger effect, as evidenced by the steep slopes
of the lines in Figures A and B.
Errors caused by
comparing over different time intervals. Another source of
error is caused by the time averaging function that is commonly used
in data acquisition systems. Many users average their radiation data
over a one hour time interval. The model calculates radiation at a
single moment in time. The average value from the datalogger is
typically associated with the time at the end of the interval (at
noon the datalogger would output an average value from measurements
made over the previous 60 minutes). If the interval is prior to
solar noon, the datalogger will output a value lower than the model
value. If the time interval is after solar noon the datalogger would
output a value higher than the model. Please check the time average
function in your datalogger and consider this source of error in
your comparison. This error can be minimized if the time interval
includes 30 minutes before and after solar noon. If the interval
includes solar noon the error is less than 1 %. Comparing
measurements made just shortly and shortly after solar noon can also
be used to minimize this error. |
|
The clear sky solar radiation
model can be used to estimate the clear sky photosynthetic photon flux (PPF).
Conversion of the value for total shortwave radiation to PPF requires the
following two factors:
1. The weighted
average energy content of photosynthetic photons (400-700 nm)
2. The ratio of the energy in photosynthetic radiation (400-700 nm) to total
solar radiation.
The energy content of the
photons is determined from Planck's equation (E = hc/lambda). The average
wavelength between 400 and 700 nm is often taken as 550 nm, which results in an
energy content of 217.5 kJ per mole of photons. We used a spectroradiometer to
determine the radiation at 1 nm intervals from 400 to 700 nm at solar noon in
the summer months. The energy content of the photons was 218 kJ per mole.
The ratio of photosynthetic to
total radiation is approximately 0.45. Meek et al. (1984) measured this ratio at
multiple sites in the western United States and found the mean value was 0.45 �
0.01 on a daily total basis. Weiss and Norman (1985) confirmed the fractional
values of Meek et al. in a subsequent study. Their measurements give a mean
value of 0.46 for what they call "a range of sky conditions". The value changed
very little over a range of zenith angles until the zenith angle was about 80
degrees. They cite multiple studies, including Meek et al. (1984), and the range
appears to be 0.45-0.50 for studies outside of the tropics. Four of the papers
they cite give a mean value of 0.45 or 0.46. The effect of changes in this ratio
on clear sky PPF are shown in the adjacent figure. |
|
References:
Meek, D.W., J.L. Hatfield, T.A. Howell, S.B. Idso,
and R.J. Reginato, 1984. A generalized relationship between photosynthetically
active radiation and solar radiation. Agronomy Journal 76:939-945.
Weiss, A., and J.M. Norman, 1985. Partitioning
solar radiation into direct and diffuse, visible and near-infrared components.
Agricultural and Forest Meteorology 34:205-213. |


